We’re reaching a bubble in the subprime auto loan industry, and very few people are talking about it. Auto Loans comprise $1.1 trillion dollars in US Household Debt as of 4Q16, a steep incline since the Great Recession of 2008. One out of every five borrowers are behind on their car payments by at least 60 days, and the average cost of a subprime loan is 10.71% as of 4Q16. 35% of financing companies’ auto loans are comprised of subprime credit scores or lower. Six million people are 90 days late or more on their car payments. Delinquency rate of all subprime loans that have been made are now being repackaged into marketable bonds. Sound familiar? 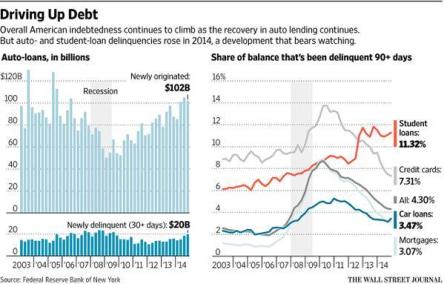
Since the crisis in 2008, auto sales have exceeded all other consumer related purchases, combined. On top of all of this, with the recent Fed rate hike of 0.25%, it could potentially put 92 million Americans at risk of increased debt payments of up to 25%. Paying 25% more on a subprime loan that is already around 11% is unsustainable given the credit and creditworthiness of the subprime borrowers.
We are by no means the first to discover this alarming trend. However, equally as important in the process of creating value for our shareholders, we are not late to the party. We at Rockvue Capital have identified the best way to play the Subprime Auto Loan bubble, and it is the best strategy given the amount of capital we are working with, and given our constraints as a fund. We want to go after the credit servicing companies, and have highlighted our first short proposition.
IMPORTANT DATA
- Subprime losses advanced 32ps to 9.62% in 2016. (Fitch, ABS Auto)
- Subprime delinquency rates are at 5.07% in 2016, an 11% increase since last year. (Fitch, ABS Auto)
- Subprime ANL (Annualized Net Loss) increased 3% in October alone. (Fitch, ABS Auto)
- The Libor Metric, which measures Financing costs, is at the highest level since 2015. (Turner, Business Insider)
- Rising delinquency rates, coupled with higher interest rates, leads to difficulties repossessing vehicles, leaving auto lenders stuck with the bill.
The Subprime Auto Loan Industry
The Obama Administration bailed out General Motors and Chrysler during the 2008 Financial Crisis, and since then, auto sales have skyrocketed. Due to the skyrocketing auto sales, credit servicing companies have seen increased competition for auto loan purchases. With the average cost of a new vehicle rising to $30,627 in 2016, it presents a tantalizing offer for credit service companies to strike deals with hungry borrowers. So, fresh off the stimulus package money, consumers do what they do best, consume.
In order to compete, credit servicing companies had to find an edge to strike auto loan deals with consumers. Since car prices were rising, there wasn’t any real incentive to offer lower car prices, given the fact that people were willing to pay more money for a car anyways. The other way to gain an edge? Loosening credit worthiness. If this is starting to sound like the housing bubble of 2005 – 2007, you’re not wrong in your thinking. Much like the housing bubble, jobs were starting to decrease, GDP was starting to lag, and debt was rising. However, in the midst of all these leading indicators, housing prices were soaring, and people were becoming home owners left and right. Most of those home owners took out crazy loans. Those loans were given to people of horrible credit, and once interest rates rose, the payments on those mortgages jumped upwards of 300% in some areas. 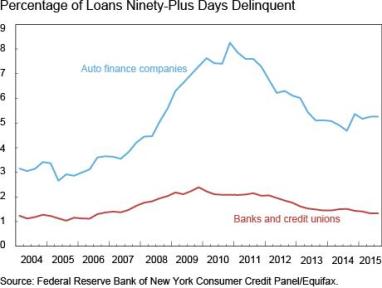
We believe a similar scenario is happening in the auto loan industry, particularly the subprime auto loan industry. We are not worried (at this moment) about the prime auto loan industry, because those loans are filled with credit scores of 670 and up. Also, we are not concerned in dealing with Car Manufacturing companies (Ford, GM, etc.) mainly because we believe the best way to profit from this bubble isn’t with the motor companies themselves, but rather the servicing companies making the loans and dealing with the dealerships directly.
This brings us to our next factor in setting this short into motion, the automotive manufacturing industry. As a whole, the automotive industry P/E sits at 17.96, much less expensive than the overall market. However, with much of the consumer demand spurring from government incentives, the data is hinting at a slowing, and even worse, a potential peak in auto sales.
POSSIBLE PEAK IN AUTO SALES
Another key point of data that we looked at to determine our short position was the possibility of a peak in automotive sales. The importance of this peak would be two fold. First, it would signify a slowing of the sale of new cars. Secondly, and we believe more importantly for our short position, it would decrease the incentives and the demand for new car loans, thus squeezing the margins of the credit servicing companies thin, while at the same time holding steady the tremendous amounts of debt they’ve incurred. 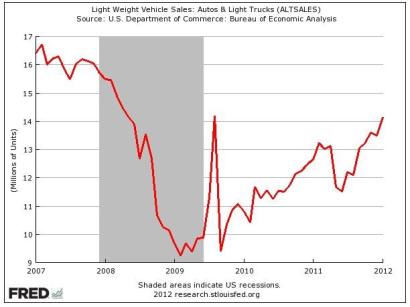
Referencing the graph to the right, you can see the trend in auto sales for 2017, as well as the same time since last year. Initial glances could render an interpretation that auto sales have peaked since December. But in order to get a better understanding of the auto market, we have to look at the major players in the industry to see how their numbers have correlated (Market Realist).
Take Ford (F) for example. Ford reported a decrease in sales YoY for the month of February, 2017 of 4%. With that in mind, Ford also reported a 3% decrease in auto sales to retail customers (Market Realist). However, when we look at other auto manufacturers, we see a different picture. General Motors increased their sales 4.2% compared to February of last year. Moreover, GM also increased their retail deliveries by 4.9% (24/7 Wall Street.com).
Because we are getting mixed signals internally within the auto industry, we do not weigh heavily on the auto sales numbers to guide our shorting thesis. Our third and final portion of our thesis deals with the credit servicing industry, and will highlight the aspects of the company we are choosing to short, as well as provide insight into the numbers that give us our confidence in our short.
We do not disclose our short position by name due to confidentiality within the firm that we have chosen to take. There may be a time when we publicly make known our short position by name, but that time is not now.
CREDIT SERVICING INDUSTRY SHORT
The industry we are shorting is the Credit Servicing Industry. Specifically, we are interested in service companies that deal with automotive loans. The company that we chose to short this bubble describes its business as, “engaged in acquiring and servicing contracts for purchases of new and used automobiles and light trucks, as well as makes direct loans and sells consumer-finance related products” (SEC.gov). You can start to see why these types of companies provide us with a direct way of shorting this bubble in the subprime auto loan industry.
Like any credit servicing company, our choice makes money by servicing loans for the purchases of new and used cars, trucks, etc. Going back to our initial overview earlier in the thesis, we presented the claim that since the Great Recession stimulus money, demand for vehicles skyrocketed, and it was revealed in US auto sales since 2008. Because of these sales, credit servicing companies have seen tremendous growth and revenues from making and giving loans to consumers. Like history tends to do, the auto loan industry is repeating much of the same maneuvers that the housing market did back in 2005. Credit servicing companies are doing this by reducing their standards in credit acceptance. What’s interesting to note is, upon reading the most recent 10-K of the company we chose to short, they verbally express these changes made due to increased competition. 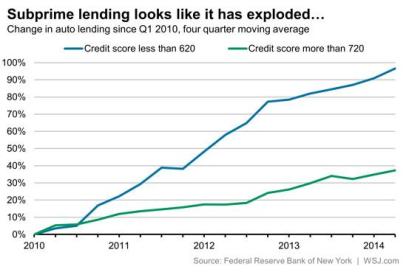
“Further, increased competition has resulted in the purchase of lower credit quality Contracts, though these Contracts are still acceptable under the Company’s underwriting guidelines.”
Warning signals began to shoot off immediately upon reading this. As a deep value investor at heart, and a contrarian by birth, my investment philosophies and teachings triggered tremendous angst inside. My first question upon reading that was, “Who’s to say the Company’s underwriting guidelines haven’t adjusted to help compete with competitors?” In other words, we can’t be certain that the company is keeping high standards internally. So, saying that the credit contracts are acceptable under the company’s current underwriting guidelines doesn’t give us reassurance at all.
BALANCE SHEET FINDINGS
Digging deeper down in the 10 – K, we found another unnerving sentence within the company. Although unnerving, it solidified our bearish position within the company due to the confirmation of our data that we analyzed. The report goes as follows,
“Historically, we have experienced higher delinquency rates than traditional financial institutions because substantially all of our loans are to non-prime borrowers, who are unable to obtain financing from traditional sources due to their credit history.”
In essence, this company only deals with subprime borrowers, consumers with credit scores less than 600. This fact made us even more confident in our short position. One of the hang ups that an investor can run into with shorts like this is the tranche levels of these subprime auto loan bundles. Knowing the company only deals with subprime borrowers makes us extremely confident in our thesis.
Looking at the numbers within the company, we can see the massive amounts of leverage undertaken by the organization, and the tremendous amounts of debt that will have to be paid. In 2012, the company had $112M in debt compared to $2.8M in cash. Since 2012, the company has acquired absurd amounts of debt, leveraging themselves to the point of insanity. In 2016, the company increased their debt position to $211M compared to a mere $1.85M in cash. The company’s Cash – to – Debt Ratio of 0.02 is lower than 94% of all global servicing companies. Another key metric in analyzing the health of a company is the spread between its ROIC (Return on Invested Capital) compared to its WACC (Weighted Average Cost of Capital). Looking at our short, they have an ROIC of 2.94% compared to a WACC of 4.58%. This spread is not sustainable. Even more frightening, these numbers don’t even reflect the environment of raised rates from the Fed.
The company is burning through cash, and it is clinging on the hopes of increased car sales to increase the amount of loans they generate for consumers. With interest rates rising, this will put extreme downward pressure on consumers to pay their loans, and it will in turn make those loans even more expensive. Rising delinquency rates have already been witnessed, and our short falls victim. There is an accounting term called Provision for Credit Losses. Basically, Provision for Credit Losses (PFCL following) is an account that companies use when they either incur or assume that payments to them will not be made. Starting in 2012, our short recorded a PFCL of $12.36M. At the end of March 2016, the company realized a PFCL of $26.27M. This signifies to any investor that the company is anticipating borrowers paying less of their loans, with more of them defaulting and going delinquent.
We believe these numbers to be just the beginning of the decline of this company, with it’s inevitable declaration of bankruptcy.
FINAL COMMENTS
Through our research, our analysis, and our connecting of the dots, we believe the auto loan industry is at the peak of their bubble. More specifically, the subprime auto loan industry will be the first industry to fail, sending credit servicing companies into freefall as their debt levels rise and interest rate hikes make that debt even more expensive to service. I don’t like using the term “A Perfect Storm” because I think in most cases it is a bit over exaggerated. However, in this scenario, no other phrase describes it as thoroughly.
Since 2009, credit service companies have ridden the heightened demand of cars via the stimulus package, which in turn has caused those companies to loosen their standards to stay relevant and to compete in the industry. Now, with these same companies over-leveraged, the economy in the midst of the slowest recovery since the Great Depression, and the Federal Reserve raising interest rates by 25 bps, the US market has created the perfect storm for the demise of the credit servicing bubble in the auto industry.
REFERENCES
“9 Home Loan Default Statistics For 2016-2017 – Trend Statistics”. Trend Statistics, 2017, https://www.trendstatistics.com/finance/9-home-loan-default-statistics-2016-2017/.
Baldwin, James. “Subprime Auto Delinquency Rates On The Rise (NICK, CPSS)”. Investopedia, 2017, http://www.investopedia.com/news/subprime-auto-delinquency-rates-rise-nick-cpss/?partner=YahooSA&yptr=yahoo.
Baldwin, James. “The Next Big Short: Subprime Auto (NICK)”. Investopedia, 2017, http://www.investopedia.com/news/next-big-short-subprime-auto-nick/.
Desjardins, Jeff. “Infographic: What’s Happening With Subprime Auto Loans?”. Visual Capitalist, 2017, http://www.visualcapitalist.com/subprime-auto-loans/.
“Fitch Home”. Fitchratings.Com, 2017, https://www.fitchratings.com/site/home.
Johnston, Matthew. “Auto Loans The Next Subprime: Jamie Dimon (JPM)”. Investopedia, 2017, http://www.investopedia.com/articles/personal-finance/060316/auto-loans-next-subprime-jamie-dimon-jpm.asp.
“Search Results | FRED | St. Louis Fed”. Fred.Stlouisfed.Org, 2017, https://fred.stlouisfed.org/search?st=auto&t=&et=&nasw=0&pageID=2.
Turner, Matt. “‘It’s Getting Worse’: An Increasing Number Of Americans Have Stopped Paying Their Car Loans”. Business Insider, 2017, http://www.businessinsider.com/mizuho-on-subprime-auto-lending-conditions-2017-3.
Turner, Matt. “6 Million Americans Have Stopped Paying Their Car Loans, And It’s Becoming A ‘Significant Concern'”. Business Insider, 2017, http://www.businessinsider.com/auto-loan-delinquency-numbers-from-ny-fed-2016-11.
“Value Investing | Market Insight Of Investment Gurus”. Gurufocus.Com, 2017, http://www.gurufocus.com/.
