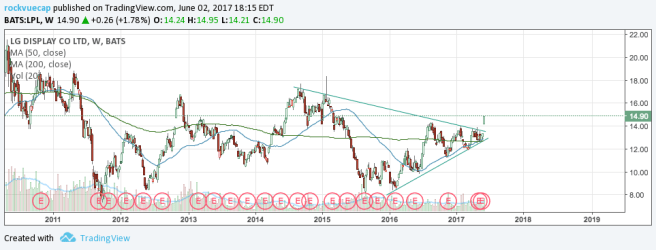
Deviating from my normal deep value investing premises, I stumbled upon LG Display Co. when searching through my consolidation screener and immediately loved the price action on the stock as the weekly price candle broke through the triangle consolidation pattern seen here:
Normally I like to screen for companies on fundamentals first, and then take a look at the price action on the charts, but I wanted to try something different. With LPL I became interested in the chart before taking a look at the fundamentals. Now I know if there’s people that follow this blog based on previous posts digging into fundamentals and then going into the charts, this might be my final swan song to those readers (It was a great ride, and thank you!). But hear me out: I’m in search of making absolute returns by any means necessary. The more I learn about financial markets and the more I study the greats that have gone before me, the more I realize that I don’t want to be put in a box. One day I’m going to write a more philosophical piece on my investment style, but part of me feels I’m not ‘worthy’ enough to publish my investing morals. Nevertheless, in the quest of alpha generating evolution, let’s dive into LPL, fundamentalists rejoice!
The Fundamentals
The Good
Starting with the good things about this company, the PE ratio is 7.73, better than 95% of the companies in its industry. Trading at 0.90 times book value, LPL is better than 81% of companies in its industry, and PS ratio of 0.43 is better than 83% of the companies in the industry.
Since 2012, LPL has increased its book value from 13.27 to 16.26. When looking at NCAV per share, LPL is seeing a steady increase in raising its NCAV. After a -8.75 NCAV in 2011, LPL has increased its NCAV to -1.71.
Increases in Operating Cash Flow per share gets chalked into the good category. Since hitting a high of 5.94 per share in 2012, LPL saw reductions in Operating Cash Flow per share down to 3.26 in 2015. However, in 2016, the company turned things around and sported a 4.30 operating cash flow per share.
Solid Margin Increase. Since December 15, LPL increased its Gross Margins every single quarter, from 10.23% to 24.34 in 2016. Operating Margin comes in a 8.33%, better than 70% of companies in the industry. ROE is 12.43%, better than 75% of companies in their industry, and ROC is a modest 15.92%, good for the highest 40% in its industry.
The Company is trading at a discount to Graham Value. Graham number is a very conservative estimate of price used by none other than Benjamin Graham. The Graham Number is calculated by taking the square root of 22.5 times TBV times EPS. Basically it is a combination of asset valuation and earnings power. The Graham Number for LPL is 25.24, and with LPL currently trading at 14.9, it is one of the cheapest ratios of the Graham number that I have seen in such a huge company (10.54B Market Cap).
The Bad
Declining revenues is a potential red flag, and since 2012 LPL had a RPS (Revenue per Share) of 38.25 that declined to 31.31 in 2016.
Total Debt Per Share hasn’t necessarily skyrocketed, but they haven’t declined either, which is what I would want to see. After reaching a high of $6.82 in 2010, total debt per share per year has been 5.51, 5.79, 5.17, 5.38, 5.04, and 5.64 respectively until 2016.
Cash To Debt ratio is also fairly awful to be frank. Their C2D ratio of 0.30 ranks it lower than 83% of the companies in the Global Consumer Electronics industry. This is going to be the biggest red flag going forward if the company has a high cash burn, but it doesn’t seem like that is the case. Looking at Net Cash Per Share, LPL hit a low of -15.47 in 2011 but has since steadily worked to increase its cash position. Since 2011 the company has increased its net cash per share to -12.25, signaling the opposite of high cash burn.
The Ugly
Negative Free Cash Flow Margins. This is the ugliest of them all, arguably worse than LPL’s cash position (or lack thereof). The FCF Margin has been all over the past over the last nine years. Since 2007, LPL has experienced 4 years of negative FCF margins. Most recently the trend is disappointing. in 2015, the company reported positive margins of 0.24%. 2016 came and those margins disappeared completely and went the other direction, sporting -1.89%.
Steady Achievements Over Last Three Years
In trying to find a catalyst that could propel the already signaled price action, I took a look at the companies most recent 10-K and found some of their R&D Developments outlined going back to 2014. The results were fairly impressive. In 2014 alone, the company had 24 new developments, with many of them being the first of their kind (during that time). Developments in 2014 include the likes of: Developing the worlds narrowest (at the time) bezel videowall product, developing a 79-inch Ultra HD TV, developing the worlds first four-sided borderless like TV, developing the world’s first Low Temperature Polycrystalline Silicon Advanced High Performance IPS photo alignment tool for smartphones.
2015 saw 16 new developments within the company. Here’s the staggering statistic from that year, out of the 16 new developments from LPL, 12 of them were either the “world’s first” or “world’s narrowest”, which is an impressive achievement in that industry. Not a bad ratio for being first.
2016 came in with the same amount of developments as 2015. Out of the 16 new developments, 11 came in as being the first in something, whether it was size, width, narrowness (that can’t be a word), or pixelation.
The Potential Catalysts
Medical Devices
When scanning through the R&D section of the companies 10-K, one line really suck out to me. During the companies R&D in 2017, they developed a medical monitor product for surgical endoscopes. The company goes on to say that, “Newly entered the medical devices market through development and production of medical monitor products for surgical endoscope.
LG is developing a medical devices segment of their business under the Home Entertainment Department (which to be honest, not too sure if medical equipment can pass as home entertainment). This could be a very good move for LG for a couple of reasons. First and foremost, the healthcare technology sector is rapidly expanding and growing, and LG has the brand recognition that smaller startups would kill for when entering the medical devices world. Secondly, the healthcare technology market in South Korea is growing rapidly. According to a journal article from the Korea Herald, “Last year [2015], the Ministry of Food and Drug safety figures showed that Korean firms produced 166.4 billion won (US$141.4 million) worth of medical image processing equipment” (Korea Herald). This isn’t the first time that a company has expanded into the medical devices industry. Sony is already a major player in the medical devices industry, the article states that, Sony [sic], launched a 4K medical monitor in Korea in November 2015″ (Korea Herald). LG is currently hiring medical device professionals like mad. If this pays off, it could open the door to tremendous amounts of new revenue streams for the already incredibly successful display company.
OLED Screen Capacity
LG is going all in on OLED screens for their devices and displays. According to PocketNow.com, “LG Display is reportedly hitting on all cylinders to bring OLED screen production to a couple of big phones, the company is said to be investing in another new plant.” LG is expected to pour $3.5B into their OLED department over the course of this year into 2019. LG already owns 95% of the mobile OLED market, and they have their sights set on Apple and Google to contract them out to make their screens (PocketNow.com). If either one of those companies contracts out LG Displays, the stock would explode like a supernova from a black hole (sorry, I let my space nerd creep out for a second). It’s no surprise that LG is going all in on their OLED production, they’re trying to both beat Samsung, but also live up to their name. At SID 2017, LG Displays was awarded with the “Display of the Year Award” for their OLED TV Panel.
The Trade Setup
Let’s bring that chart down from the top so we can look at the trade set up one more time:
In my TradingView paper account, I initiated a long position right at the break of the consolidating triangle on the weekly charts. I set my stop loss below the bottom end of the triangle at $12.37. That way, if my stop gets triggered, I would know that I’m wrong and would exit the trade quickly. I risked 0.51% of my trading capital on this trade, mainly because I entered this position before taking a deeper dive into the fundamentals. Although I wouldn’t necessarily do this when managing clients money, I want to experiment with going off of price action and then fundamentals. George Soros once said (and to paraphrase) that for some investments he “buys first, investigates later.” This is one of those instances.
LG Displays is revving with innovation and energy, and investing nearly $4B into a new OLED display plant means LPL isn’t playing games. We’ll see what happens in the price action from here.
As always, shoot holes in this idea, or any other idea you find on this blog. Healthy debate is what makes people grow in knowledge. If you think I’m wrong, let me have it in the comments.
