Its been a crazy week with the first full week of classes starting, and yes, it is finally the last year of schooling for me! But with the Labor Day Weekend extending my freedom by another day, it gives me time to send y’all a heads up on what I am thinking about going into next weeks trading. Although I have dozens of companies that are on my “radar”, there are only a select few (if that) each week that could be a potential trade set-up. A lot of the companies on my radar are longer term set – ups, developing set – ups, or companies that I am waiting for a drop in share price. Going into this next week I have two main charts that I am focusing on for potential trades, both of which I will dig into here.
As always, if you have any further questions, or you think my idea is stupid and I am missing something blatant, please email me. I love discussing ideas and bullet – proofing strategies whenever possible.
Chart 1 – Silver
I’m slowly beginning to realize that my writing has developed a quasi fetish towards silver. In all seriousness, silver has been on my radar for months, possibly a full year. I bought physical silver back in 2014 which I keep as a stowaway, but that was before I started getting extremely serious about the markets. Silver futures charts are looking extremely interesting as a bullish set – up. When it comes to charts, I like to follow Peter Brandt’s style (which, why wouldn’t one want to, with his 42% annualized return). Like Brandt, I first look at the weekly charts to see if there is a pattern setting up, from the weeklys, I dive into the dailys for an entry point and to place my stop losses. After recognizing a pattern on the weekly chart, I will use the daily chart to move my stop losses up or down according to which side of the trade I’m on.
Here’s the Weekly Chart for Silver Futures Continuous:
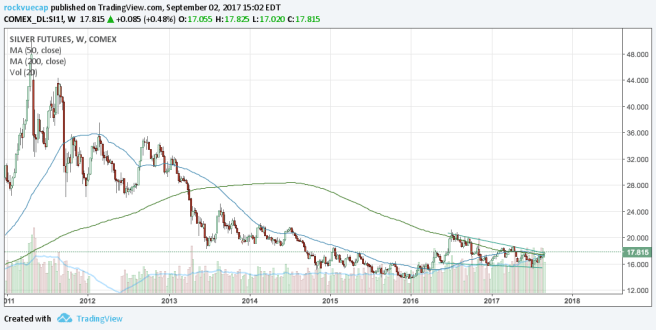
From the charts, you can see the descending wedge pattern forming. What is important to note is that price action already broke the 200 MA, and is at the literal tip top of that resistance line going back into mid 2016. This will be the fourth time silver has tested its descending resistance level, and if it breaks through this time, it could be a powerful move upwards. That’s the beauty of waiting for chart patterns to develop: There is a clear right or wrong when it comes to your trade. If it breaks through that price resistance, I will put an order in and place my stop right below the 200 MA on the daily chart.
I am a bit more confident in the possibility of a breakout in silver this time around because I have a potential double confirmation from both the weekly and the daily charts. Whenever you have two different time charts confirming a pattern, your odds of success increase. That’s what this entire game is about anyways, creating a positive edge in the markets.
Here is a picture of the daily chart for the same Silver Continuous Future:
What’s important to notice is that there is a confirmation of price breaking out of the resistance on the daily chart, and the weekly chart is close to follow. That is why Tuesday’s trading day is so important for silver, and will determine whether or not I place an order.
Now onto the topic of risk capital, I might edge closer to 100bps of risk, just given the increased confidence I have in the charts and in the sentiment around the market (increased volatility). I will confirm on the day of the trade if and when that happens, but for right now I am looking between 75 and 100bps risk.
Chart 2 – Jakks Pacific, Inc. (JAKK)
Most of you reading this have experienced Jakks Pacific merchandize at least some point in your life, most notably during the Holidays. GuruFocus has a great description of Jakks Pacific, saying:
Jakks Pacific Inc is a toy and leisure products manufacturing company. Its products offering include traditional toys and electronics such as action figures, toy vehicles, dolls and accessories, ride-on toys, toys for pets. They also offer role play, novelty and seasonal toys such as dress-up, pretend to play toys, Halloween and everyday costumes, junior sports, and outdoor activity toys. The brands under which these products are sold include Road Champs, Spy Net, Fisher Price, Kawasaki, JAKKS Pets, Disney Frozen, Black & Decker, Spiderman, Toy Story, Sesame Street, among others. Its products are sold to customers in the United States, Europe, Canada, Hong Kong, and Other parts of the world.
In short, they make toys for children (Unless there’s one reader who yells to himself, ‘They’re collectible figurines thank you!’). Unlike their toys, their charts are ugly, and times are tough for the company. Before we dig into the technicals, let’s see why I am evening worrying about JAKK as an investment. Remember, with equities, I always put more emphasis on the narrative around the company before I assess the chart. This is something that I file under the category of ‘Strong Opinions Weakly Held’ because certainly there have been times where I have seen a chart so tantalizing I will, as George Soros says, “Buy First and Investigate Later”.
The first thing that popped up to me with JAKK was their valuation. JAKK is trading for roughly 50% of Book Value. That discount is better than 80% of competitors in its industry. Because of this, it begged the question in my head, ‘How could such a huge, reputable brand like JAKK be trading at such a steep discount?’ The digging led me to their latest quarterly report.
Why The Sell – Off Occured
The biggest reason for the share decline was their drop in sales. JAKK reported a 10% decrease in sales QoQ, due to what they referred to as Sales Comparisons and Timing of Expenses. The decline in sales was linked to the decline in the retail space as a whole, with JAKK forced to suspend the sale of their product in certain stores due to shutdowns. To add to the decrease in sales, JAKK COGS (Cost of Goods Sold) increased 10%, a double whammy negatively affecting bottom line profits and margins.
The other major headwinds for the company that affected the bottom line was the suspension of toys from the new Star Wars movie and Frozen. Frozen provided a healthy dose of sales revenue for the company after that movie rocketed to #1. The good thing about a company like JAKK is that the movie industry isn’t dying. In fact, demand for super hero movies seems to increase. With Marvel and DC virtually dominating the big screen production, one can safely assume that JAKK will have more than enough content to dig from for their toy production. On that note, I want to discuss why I think the market isn’t realizing the importance of the brand name, the demand for products from movies, as well as the increase in free cash flow from the company.
What Wall Street Doesn’t See
Sometimes I think Wall Street gets too wrapped up in sales numbers and forgets other crucial aspects of a business that are not only performing well, but are increasing in their performance. When it comes to JAKK, that increase in performance is from free cash flow. Although sales numbers decreased 10%, JAKK was able to increase their FCF by 101% and their operating cash flow by 122%. The company also is trading for $3.84 per share in cash, which is a $0.40 discount to current price. In other words, Wall Street has beaten down this stock merely off of a missed sales number for one quarter.
JAKK is taking direct effort to fix the problems of the most recent quarter. JAKK is increasing their master global reach of toy licenses in a host of countries, and most recently opened up a branch in London. For the remainder of 2017, JAKK is branching into the sporting / outdoors industry as well as Cosmetics.
The most important aspect of the JAKK business developments come from their online space. I stress this with every company in retail that I investigate … How are they competing online, and how are they making themselves more accessible online? JAKK has expanded and grown its online presence tremendously. Online sales are up 50% YoY for the company, a great sign of mobility.
The Chart
Notice anything crazy about this weekly chart? JAKK hasn’t been this low since 1997. To put that in perspective, they haven’t been this low since my 3rd birthday. At these levels, there is price support, its just very far dated. If it can hold this price level though, it would present significant support from it. Moving on to the daily charts we find a similar story.
On the daily charts, JAKK is very close to breaking both price resistance levels going back to the start of 2017, as well as the 50 MA. Whenever I dissect these companies that are trading at a steep discount to book value, and even a discount to cash, it’s extremely important to try to increase the possibility of buying after a bottoming formation. Note: I am not trying to ‘pick’ a bottom in a stock, what I am saying is that its important to buy off of a basing pattern with momentum heading upwards.
When looking to buy JAKK, my entry position would be on the 3.65 – 3.70 price range, and I would put my stop loss around the 3.30 price range, right below the price support on the most recent coiling pattern formation.
Takeaway & Email Notification
These are two of the top charts that I am paying attention to coming into the trading week. If you have any concerns or questions on these two potential trades, shoot me an email or text if you have my number.
One thing that I would like to stress is that this website isn’t the only place that I communicate with potential investors or partners interested in investing with me. I have a list of people whom I email on a semi regular basis where I discuss individual trades and results of my two funds. If you would like to be included on this email list, leave me a comment in the comments section, or shoot me a personal email regarding your inquiry.
