Garrett Motion (GTX) is the newly spun-off company from its parent, Honeywell, Inc. The company designs, manufactures and sells turbocharger and electric-boosting engines and engine technologies for Original Equipment Manufactures (OEM’s) as well as aftermarket. GTX is a global leader in technologically advanced turbos and boosters, delivering products across gasoline, diesel, natural gas and electric power-trains, hitting every market from small cars to commercial equipment.
The company is mis-priced by the market for reasons unrelated to its business operations. Forced selling resulting from the recent spin-off, China trade war worries, and a large (but misleading) liability item on the balance sheet could keep share prices low, offering investors a chance to buy a good business at a great price. The company generates significant cash flow, flexes an industry leading supply chain manufacturing process, and institutes an incredibly lean capital cost structure. Deep relationships with its customers and OEM’s spanning three decades creates a wide moat and its 1,000+ patents help entrench the durable competitive advantages it has over its competitors. Couple that with turbocharger market penetration expected to grow from 47% to 59% by 2022 and you have a good business, a cheap price, and a long runway.
Reasons for the Spin-Off
According to GTX’s Form 10, Honeywell decided to spin off the turbocharger manufacturer for the following reasons:
- Enhanced Focus & Simplified Organizational Structure
- Distinct and Compelling Investment Cases
- Performance Incentives
Enhanced Focus & Simplified Organizational Structure
In most spin-offs, this reason will be at the top of the list. Considering Honeywell is a giant conglomerate of various independent businesses, splitting up their turbocharger business gives both Honeywell and Garrett the option to reallocate time, capital, and resources into doing what’s best for their specific business.
Distinct & Compelling Investment Cases
By spinning off the turbocharger business, Honeywell gives its investors a much clearer picture of which company they ultimately want to invest with. They can choose to keep Garrett Motion along with their Honeywell shares, or they can dump Garrett Motion all together.
Performance Incentives
When looking into spin-offs it’s important to look at the incentive structure for the newly minted management. I want to see management incentives that are properly aligned shareholders and the success of the business.
CEO Oliver Rabiller will start with a base salary of $891k with an annual cash incentive target opportunity equal to 100% of his annual cash base salary. Mr. Rabiller is eligible for this incentive should the company hit various earnings goals throughout the year. Along with the cash bonus, Rabiller is eligible for an annual grant of stock options with an initial target opportunity of 325% of base salary. These stock options are contingent upon increased business performance. CFO Alessandro Gili is also incentivized well, receiving an annual salary of $524k, cash bonus equal to 75% of salary, as well as annual grant of GTX restricted stock valued up to $1.48M.
In other words, the big bucks will come from increased performance of the business, and management will be heavily incentivized to see the success of the business through. Garrett succeeding means that executives could receive upwards of 400% of their annual base salary. Not a bad payday!
Business Deep Dive
GTX got its start in the turbocharger business after producing its first engine back in 1962. Garrett designs, manufactures and sells turbocharger engines. They sell across broad markets from gasoline to natural gas, and hybrid fuel cell powertrains. These turbochargers improve vehicle performance while also addressing regulations regarding fuel efficiency and exhaust emissions.
Garrett is a leader in the global aftermarket space with a network of over 160 distributors spanning 160 countries. Through their connections, the company provides close to 5,300 parts and products. The company leads the aftermarket for both service replacement turbo engines and high-end racing engines. The company estimates that roughly 100 million cars use a GTX product in some shape or fashion. To cap it all off, the company sports over 1,400 patents / pending patents, protecting their proprietary technology from competitive forces.
The Main Drivers of Business Performance
Deep Relationships with Customers & Top Quality Products
The company has stellar global management, a comprehensive portfolio of products and long-term relationships with OEM’s. Garrett leads (or is tied as a leader) in the following product spaces: Light vehicle gas, light vehicle diesel, commercial vehicles, and e-boosting. This is seen through the tremendous length of commitments it has with its customers. Here’s a list of some of those relationships:
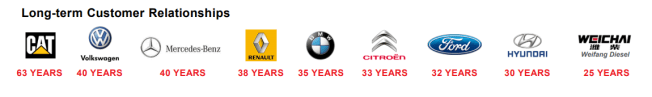
These long-term relationships translate into high competitive advantages. If you go through the life-cycle of a relationship between the engine maker and its customer, you start to realize the immense switching costs that would be incurred should a customer leave its current engine supplier. Garrett captures customers in all stages of a product life cycle: Pre-Development, Product Development, Vehicle Production, and Aftermarket.
Industry Leading Supply Chain Management
Another strength for Garrett is its Supply Chain Management, sporting 13 state-of-the-art facilities around the globe, 75% of which are in high growth regions. Due to their advantages, Garrett is able to churn out over 50,000 turbocharger engines per day. That’s 40 turbo engines every minute. So how exactly is Garrett able to produce such high amounts of turbos? The answer lies in their highly differentiated manufacturing process and low-cost operating model.
Differentiated Internal Technology & Lower Cost Operations
GTX touts industry firsts for high-speed electron-beam and laser welding. This proprietary technology enables it to test and approve engine parts quicker with greater accuracy. The company also leverages its supply base, sourcing a little over 80% of its costs from its suppliers. The company invests in its products with the goal of building more and more parts in-house instead of reaching out to suppliers. Garrett remains the only turbocharger engine manufacturer to operate a high-grade wheel foundry.
The company spends an average of 3% of revenues on capital expenditures, and expects to continue that range between 2-3% over the next five years. GTX increased its variable costs (as a percent of total cost structure) from 67% to 80% today. This is important because it gives GTX flexibility to support its business operations through troughs in its business cycle. The company has shifted its cost supply from 45% in low-cost countries to close to 70% today. The costs are split between three areas: 56% in EMEA, 15% in the Americas, and 27% in Asia. Finally, the company was able to increase its working capital turns from 12x to 20x.
82% of Garrett’s operating costs are in cost of goods sold. SG&A comes in around 7.5%, and R&D plus other expenses fill out the remaining 10%. Such high levels of operating costs coming from cost of goods sold can present both an opportunity and a risk. If the company is able to negotiate on its cost of goods sold (get to the first principles of how it manufactures), it could add significant incremental margin power. However, if most of its cost of goods sold is commoditized products, changes in natural resources could have detrimental impact on revenues and margins.
These strengths give Garrett a competitive advantage. First, its highly variable cost structure enables the business to adapt and shift during periods of recession in its cycle. Second, the company doesn’t have any large-scale restructuring programs for the near future. Finally, Garrett has low working capital needs, giving it incremental cash generation to reinvest back into the business.
The Financials
Breaking Down Revenues
Garrett generated roughly $3.1B in revenues in 2017. Light vehicle products accounted for 80% of revenues with the remaining 20% coming from commercial vehicles (such as construction, agriculture and power-generation machines). Out of that $3.1B, 88% of sales come from sales to OEM (Original Equipment Manufactures) and the remaining 12% from the global aftermarket. The company diversifies their revenues well: 52% from Europe, 30% from Asia, 10% from the US, and 8% in other regions.
The company has strong revenue bookings going into 2018 and beyond. Near-term revenues are close to 100% booked. When Garrett looks out to 2020, 87% of their revenue is already booked. Looking further out to 2022, the company has already been awarded 63% of its future revenues.
These percentage trends are consistent with what Garrett has historically done over its life-cycle. Taking a look at wins on key engine platforms the company won 45% of its key engine gasoline bids, 55% of its diesel competitions, and 50% of its commercial competitions.
Where Is Future Growth Coming From?
These future revenues are supported by the expected growth rate in turbocharger engine adoption across regions. North American penetration is projected to grow 16% by 2022. South American penetration is expected to grow by 26% by 2022 and Chinese penetration is expected to grow from 47% to 70% by 2022. Along with the growth in their core line of business, the company is projecting new growth from areas such as E-Boosting and Connected Vehicles. The company is projecting organic revenue growth to the tune of 4-6% going forward.
High growth opportunities with E-compressors and E-turbo engines creates new avenues for revenue growth in new markets. E-boosting and E-turbos will play a vital role in the hydrogen fuel celled cars we’ll see in the future. Garrett has been producing these E-compressors since 2016 and is currently engaged in more than 10 projects with its OEM’s. Connected Vehicles consists of cyber-security and integrated vehicle health management. The company is also expected to be the first to market on the first completely electric e-turbo engine. Garrett currently generates close 5% of its annual revenues from these new high growth areas. Revenues in this category grew 16% from 2016 – 2017.
Variant Perception – Why The Opportunity Exists
Forced Selling
There are two main reasons why this opportunity exists: Forced selling from spin-off and misleading liability on the balance sheet. Let’s start with forced selling. With any spin-off, there are going to be new shareholders that may not want their shares of the newly spun-off business. In some cases, these people and institutions sell without doing any due diligence into the business. Whether it doesn’t fit their current portfolio model, or there are institutional restrictions on owning spin-offs, forced selling can happen swiftly after initial trading.
Misleading Liability on Balance Sheet
Honeywell and Garrett Motion entered into an Indemnification Obligation for liabilities related to the Bendix Asbestos incident going back to the 1920’s. So why create this Indemnity Agreement? Creating an Indemnity Agreement frees up liabilities for Honeywell on its balance sheet, at least on paper. However, Honeywell will retain the legal obligation related to the liability, as well as managing claims and administrative processes. This means that Garrett is responsible for paying annually while not transferring the actual legal liability to the company. According to their Investors Presentation, the company will not be responsible for more than $175MM in payment. If the company continues to pay the $175M payment annually, the asbestos liability will be off the balance sheet by 2025.
This company won’t screen well is because on paper it has a tremendous amount of debt, to the tune of $1.36B. This is very misleading, and upon digging a little deeper, you realize that the $1.36B liability is really an annual expense of up to a maximum of $175MM.
So what’s the effect of the Indemnity Obligation on earnings? Let’s take a look at the breakdown from 2015 – 2016, 2016 – 2017, and the first half of 2017-18. In 2015-16, before the Indemnity Obligation the company generated $526MM in EBITDA. Backing out the $175MM leaves us with $351MM in EBITDA, or an 11.7% EBITDA margin. In 2016-17 the company generated pre-indemnity obligation EBITDA of $623MM. Backing out the obligation leaves us with $448MM, or 14.5% EBITDA margin. Finally, for the most recent first half comparing ’17 to ’18, the company generated $372MM pre-obligation and $284MM post-obligation for a near 16% EBITDA margin. Even with the obligation payment, the company maintains industry averages in margins.
Back-of-Envelope Valuation (Intrinsic & Relative)
If we look at Garrett’s closest competitors, we can get a sense of the relative valuation averages. For instance, Cummins, Inc is projecting 2020 EBITDA of $3.8B. Given its current EV of $26.41B that puts CMI at 6.9x 2020 EBITDA. Another competitor in the market is BorgWarner (BWA). BWA is estimating EBITDA to hit $1.9B in 2020. With a current EV of $11B that represents a 6.26x 2020 EV/EBITDA.
Bear Case: -5% CAGR EBITDA Growth
If the company is expecting EBITDA to grow roughly 4-6% CAGR, a bear case scenario might be the exact opposite of that. For this valuation we’re going to assume -5% annual EBITDA growth. 2022 EBITDA comes in at $442. After adding back D&A (historically ~10% of EBITDA), net working capital, and capital expenditures (around 18% of EBITDA historically) we’re left with 2022 unlevered FCF of $164MM. Applying an 11% discount rate to those cash flows we’re left with a sum of the present value of cash flows at $636M. Assuming a long-term growth rate of 3% into perpetuity, we generate a terminal value of those cash flows in 2022 for $2,251M. Finally, we arrive at an Enterprise Value of $2,003M, giving us an EV/EBITDA of 4.87x.
From here we need to calculate our net debt. Luckily GTX gives us net debt in their latest 3Q Earnings presentation:
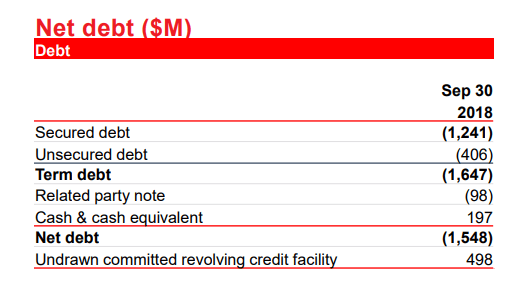
Subtracting the net debt from our enterprise value and dividing by shares outstanding (74M) leaves us with an equity value per share of around $7.30. This represents a downside of close to 50% from current share prices.
If we do relative valuation for Garrett, the picture becomes a little better. Peers are trading at an average EV/EBITDA multiple of 6.2x. Assuming over the long-term that GTX will trade in line with peers, equity value per share comes out to roughly $11.30/share, or a ~30% downside from current prices.
In a really bad case, let’s assume GTX experiences a recession like the one we experienced in 2008-09. As a comparison, BorgWarner (which is one of Garrett’s closest competitors) experienced a decline in EBITDA by 50% but traded at an EV/EBITDA multiple of 9x. If GTX’s 2020 EBITDA was cut in half to $248M and we applied our 9x mutliple, GTX would trade at a roughly fair range of $13. That’s not bad either. (source: StockSpinOffinvesting.com).
Stagnant Case: No EBITDA Growth, Consistent CapEx & NWC
Let’s now assume zero EBITDA growth for the next five years. Looking out to 2022 we get EBITDA of $571M. Adding back D&A, change in NWC, and capital expenditures, we arrive at a 2022 FCF of $239M.
Keeping everything constant with the previous example, our long-term growth rate of 3% gives us a 2022 FFCF of $247M, and a terminal value of $3,289M. Adding our PV of Terminal Value to our present value sum gets us an Enterprise Value of $2,797M. This Enterprise Value gives us a 4.90x EV/EBITDA multiple for 2022.
Holding net debt and total shares outstanding equal we’re left with an equity value per share of around $18.03, or ~25% higher than current trading prices. Using competitors average EV/EBITDA multiple of 6.2x gets us an enterprise value of $2,950M and an equity value per share of $20, 27% higher than current prices.
Bull Case: 4% CAGR EBITDA Growth
The company is estimating $640M in EBITDA for 2018, $601M in 2019 and $605M in 2020. If we assume 5% growth for the remaining two years we’re left with a 5 year average growth rate of 4% and a 2022 EBITDA of $667M. Subtracting taxes, adding back D&A and changes in NWC as well as subtracting CapEx leaves us with $296M in 2022 unlevered FCF. Holding long-term growth rates constant we get a terminal value in 2022 of $4,276M and an enterprise value of $3,390M, or 5.08x EV/EBITDA.
In this scenario we’re going to assume GTX is able to pay down its debt a bit faster, reducing its net-debt level to $1,261M. From here we get an intrinsic value per share of around $30, representing a potential upside close to 100%. Applying our EV/EBITDA competitor multiple of 6.2x gets us an Enterprise Value of $3,603M and equity per share value of around $30.
Risks
There are many risks with this investment. The Auto parts industry is cyclical beast, the shift towards electric vehicles puts downward pressure on gasoline and diesel sales, and OEMs try to penny pinch manufacturers, straining margin expansion. Many auto parts makers claim that they have the leanest cost structure, the highest variable cost model, etc. It will be important to see if Garrett can maintain that cost structure if/once its OEM’s start squeezing during cyclical downturns.Failure for the company to reduce its leverage (current target leverage rate of 2x) could increase interest expense in a rising rate environment.
Looking beyond the next five years, the competitive advantage will go to the company that can adapt and benefit from hybrid and electric engine penetration. If Garrett fails to be the leader in the hybrid / electrical engine space, it could significantly damage future growth prospects as the runway for growth transitions from gasoline & diesel to electric and hybrid.
Wrapping It Up
Garrett is off the beaten path. It’s a spin-off in a cyclical industry with a misleading liability making it appear incredibly debt ridden. Forced selling has created a fantastic opportunity to buy shares of a business trading at a significant discount to its peers on an EV/EBITDA and intrinsic value basis. If the company manages to grow revenues as anticipated, investors are given an opportunity to buy a company with a long runway for revenue, multiple, and cash flow expansion at a large discount.

Wow, this was great. Keep writing this kind of texts, you will get a lot of people to this blog if you continue doing this. I will be visiting this site more often. thanks
LikeLike